

Assessing fluctuations in circuit load
Associated issues

- Field measuring instruments only allow you to check instantaneous values.
- Field measuring instruments can also display maximum and minimum values, but it’s not possible to ascertain the times at which they occur.
- You don’t have a data logger.
Solved by GENNECT Cross!
- GENNECT Cross can graph fluctuations in current consumption in real time.
- You can ascertain the times at which maximum and minimum values occur as well as the average value.

Your field measuring instrument will become a data logger.
The load fluctuation graph is updated in real time. It can be logged at an interval as short as 1 s.
Since up to eight instruments can be logged simultaneously, you can assess load fluctuations in eight circuits.
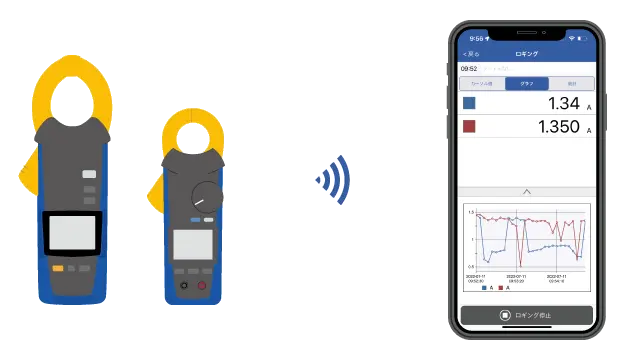
Recorded data includes the maximum and minimum current consumption values as well as the times at which those values occurred and the average value.

GENNECT Cross functions used
Supported instruments
View the list of supported instruments →
Want help or have questions?