

Configure the Show Setting
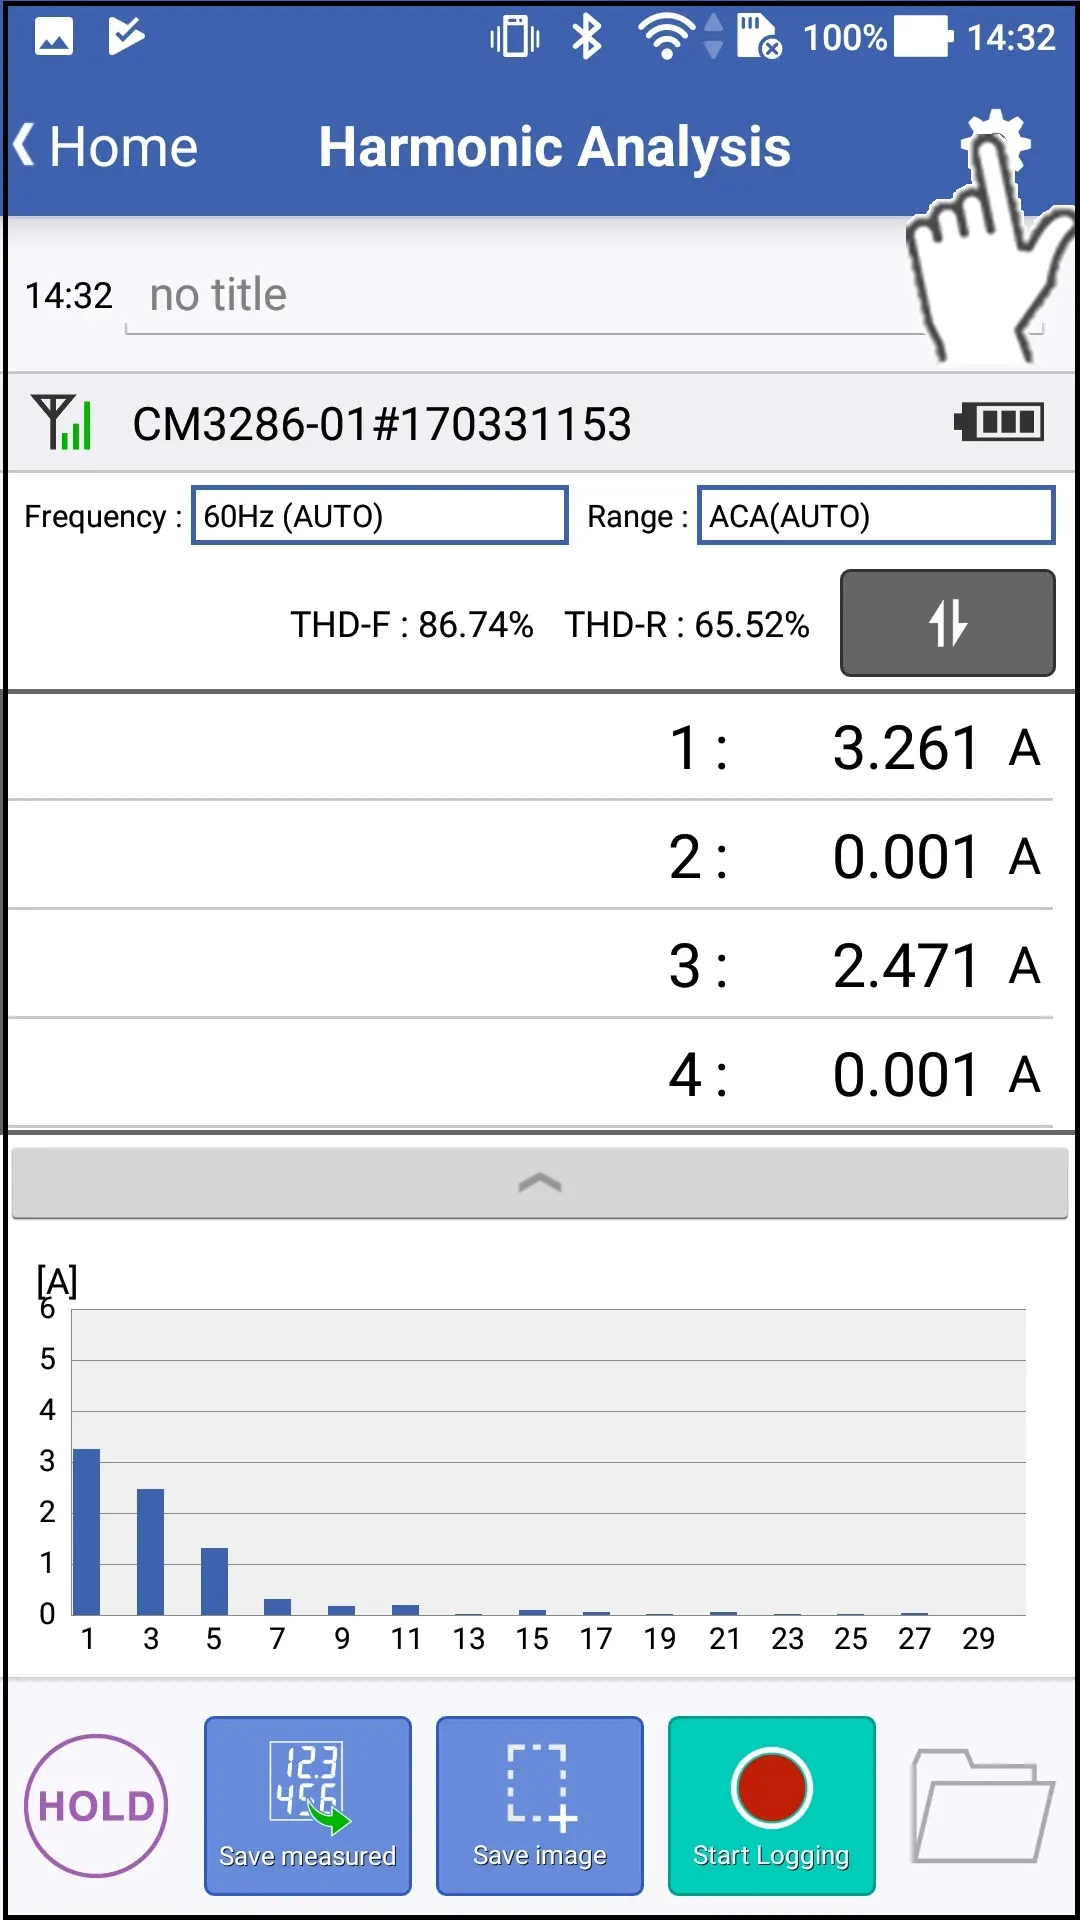
As well as change configure the show setting during measurement and logging , it will be able to change the saved data later.
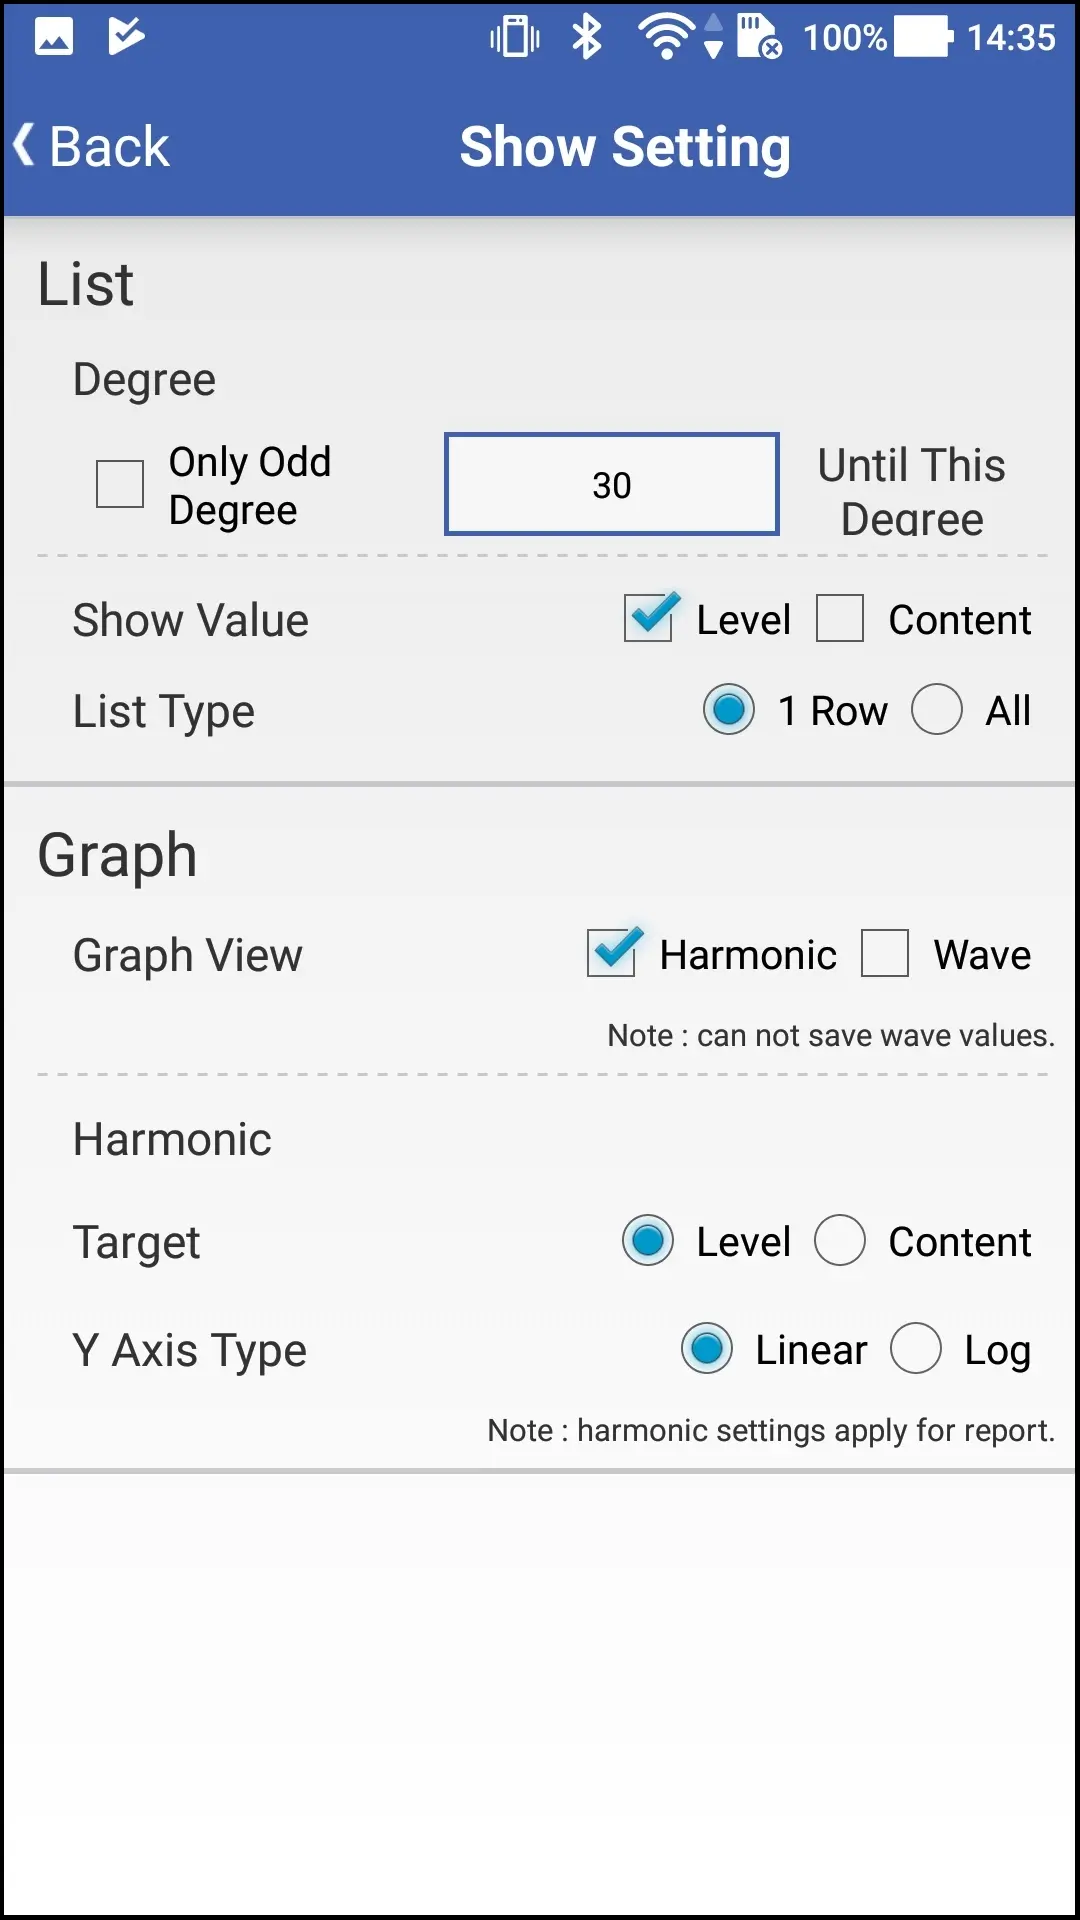
List
Degree
・Only Odd:You can only make odd degree appear in the list
・Until This Degree:You can set the maximum value of degree to be displayed in the list (1 to 30th order). Please set the degree in the setting dialog
Show Value
You can choose value to show from "Level" , "Content" and "Level and Content"
List Type
・1 Row:Show the measured values in a row.
・ALL:Show the measured values in multiple rows.
Graph
Graph View
You can change the type of graph to display.
You can choose graph type from "Harmonic" , "Wave" and "Harmonic and Wave".
Note:can not save wave values.
Harmonic
ou can chooset the target of the harmonic graph.
You can choose either "Level" or "Content" .
Harmonic Y Axis Type
You can choose the scale of the Y axis type of the harmonic graph.
You can choose either "Linear" or "Log" .
Note:harmonic settings apply for report.