

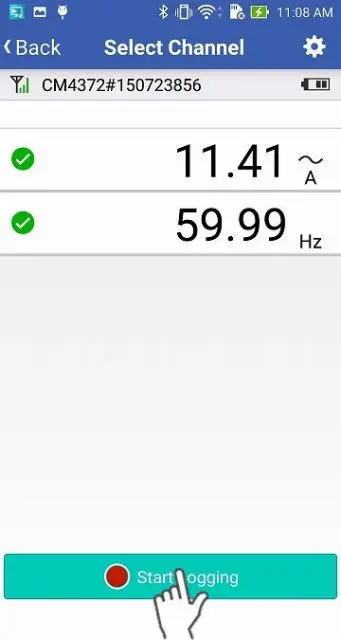
Useful functions for "Logging"
Open the "Logging" screen and tap "Start Logging".
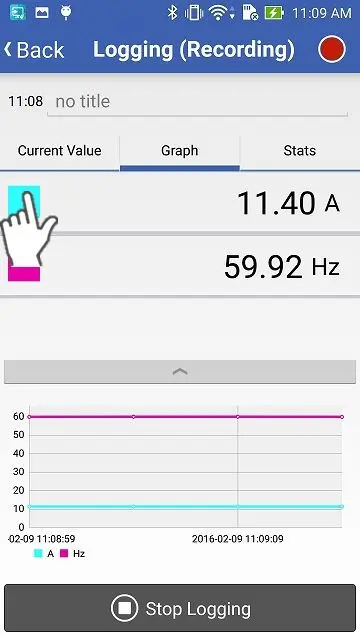
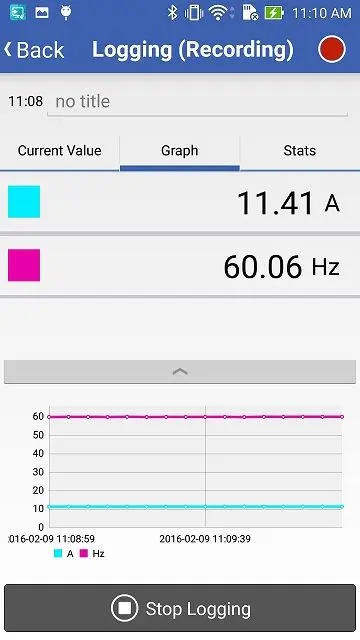
Change the color of the graph
1
Tap the color mark of the channel which you would like to change the color.
2
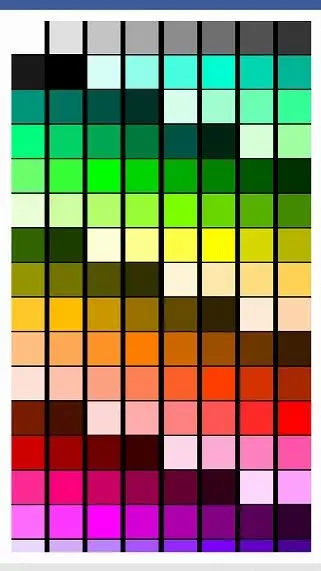
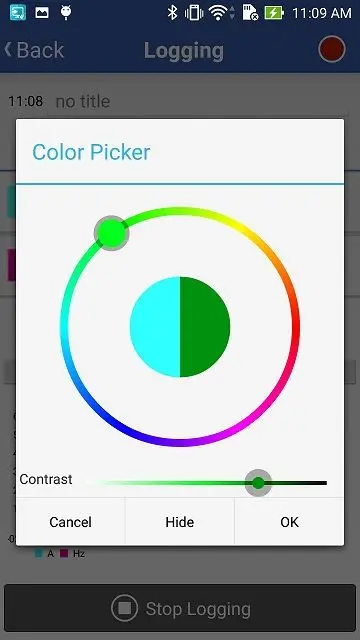
Select the color. If you do not want to show the parameter on the graph, tap "Hide".
A color selecting method depends on the type of the OS (iOS, Android).
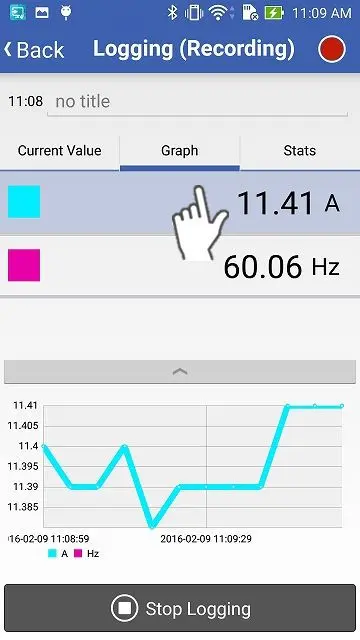
Highlight a graph
1
Tap the measured value, then its line on the graph is highlighted.
Display cursor values
1
Tap the line with your finger and you can see the measured values at that point.
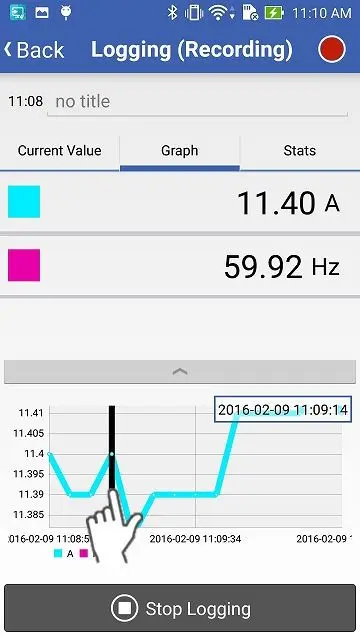
2
The highlight and the cursor will be disabled after a long tap on the graph.
Want help or have questions?