

Displaying measured values and vector diagrams
The Vector function allows the app to display and save vector diagrams for measured values such as line-to-line voltage, frequency, and unbalance factor.
1
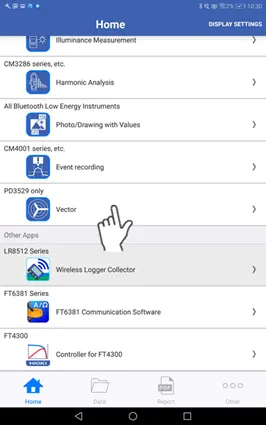
Tap "Vector" on the home screen.
If no instrument that supports the Vector function has been paired with the app, first add a compatible instrument.
2
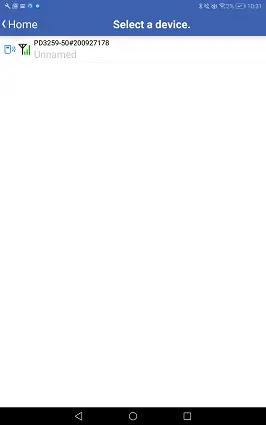
The instrument will be connected to the app in about 5 to 30 seconds on the instrument selection screen.
3
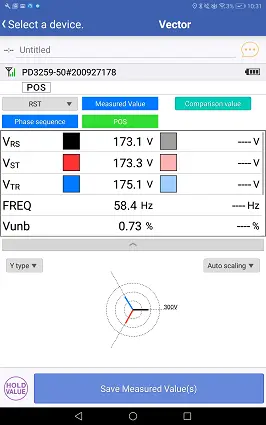
You can display measured values and vector diagrams on the measurement screen.
Measured values are shown in the measured value area at the top of the screen.
Vector diagrams are shown at the bottom of the screen, and you can change the rendering method.
For more information about how to change the rendering method along with information about each method, “Changing the graph display format.”
Vector diagrams are shown at the bottom of the screen, and you can change the rendering method.
For more information about how to change the rendering method along with information about each method, “Changing the graph display format.”
4
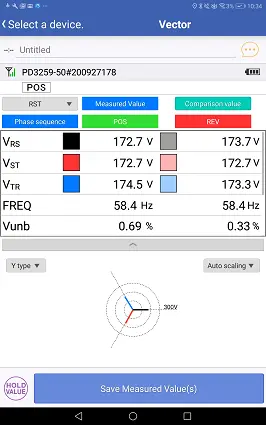
You can also display and compare saved data.
For more information about how to compare data, see "Comparing data (referencing comparison values).”
Want help or have questions?