

Displaying waveform and frequency characteristics
The CM/DT series provides functionality for displaying voltage and current waveforms(allowing the instrument to serve as a simple oscilloscope) and for displaying associated frequency characteristics.
1
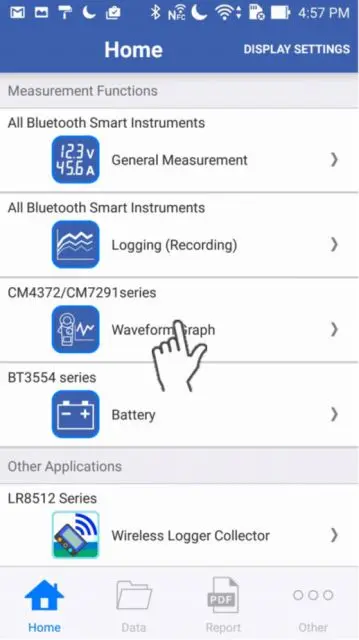
Tap [Waveform/FFT] on the home screen.
※If you have not yet paired the app with an instrument that supports the waveform display function, Add other measurement instruments first.
2
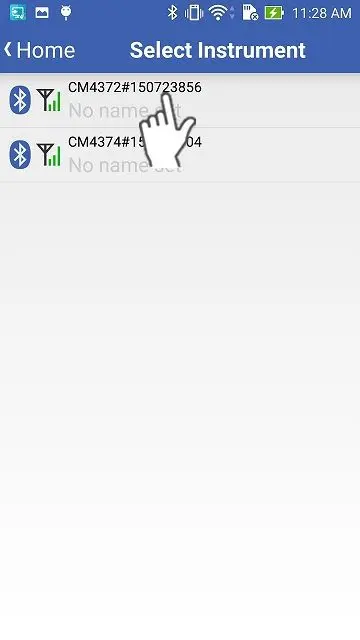
The app will automatically connect to paired instruments if you wait while displaying the [Select a Device] screen (for about 5 to 30 seconds). Choose an instrument for which you wish to display waveforms.
If 1 minute or more elapses and the app has not yet connected to an instrument, see "I can’t connect to GENNECT Cross"
3
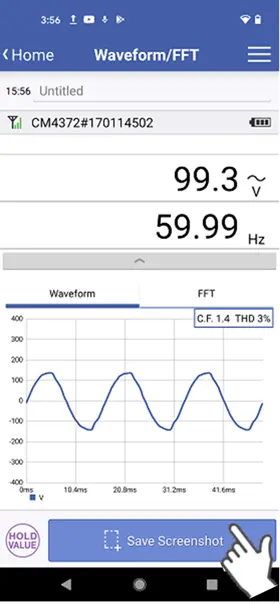
When you make measurements with the instrument set to the voltage or current function, the app will display the associated waveform. To save an image of the waveform, tap [Save image] button.
You can cycle the display through the following content by tapping the gray bar: Waveform → Measured Values → Measured Values + Waveform.
C.F.(Crest factor) and THD(Harmonic distortion factor) are reference values.
C.F.(Crest factor) and THD(Harmonic distortion factor) are reference values.
4
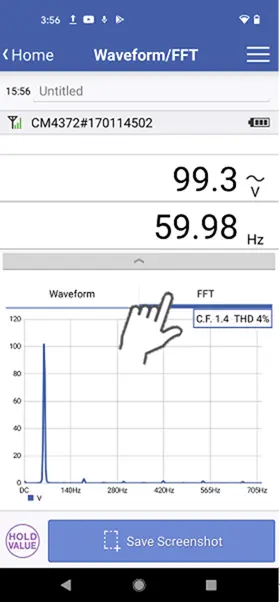
Tap the [FFT] tab to display the waveform’s frequency characteristics.
The app may be unable to display the frequency characteristics if the observed waveform is not continuous.
Frequency values shown as measured values may differ from frequency values displayed as frequency characteristics.
Frequency values shown as measured values may differ from frequency values displayed as frequency characteristics.
Want help or have questions?