

Display measured values & graph
With this function, CM3286-01 can be used to analyze the first to thirtieth harmonics of current and voltage.
You can confirme and record Harmonic level / Content / Total harmonic distortion rate ,and harmonic graph / input waveform.
Equipment other than CM3286-01/CM3286-50 is not guaranteed to be accurate
During harmonic analysis,"Rotary switch" and "Key" of CM3286-01 is disabled. Also, irrespective of the position of the "Rotary switch", it switches to the measurement target selected by this application.
1
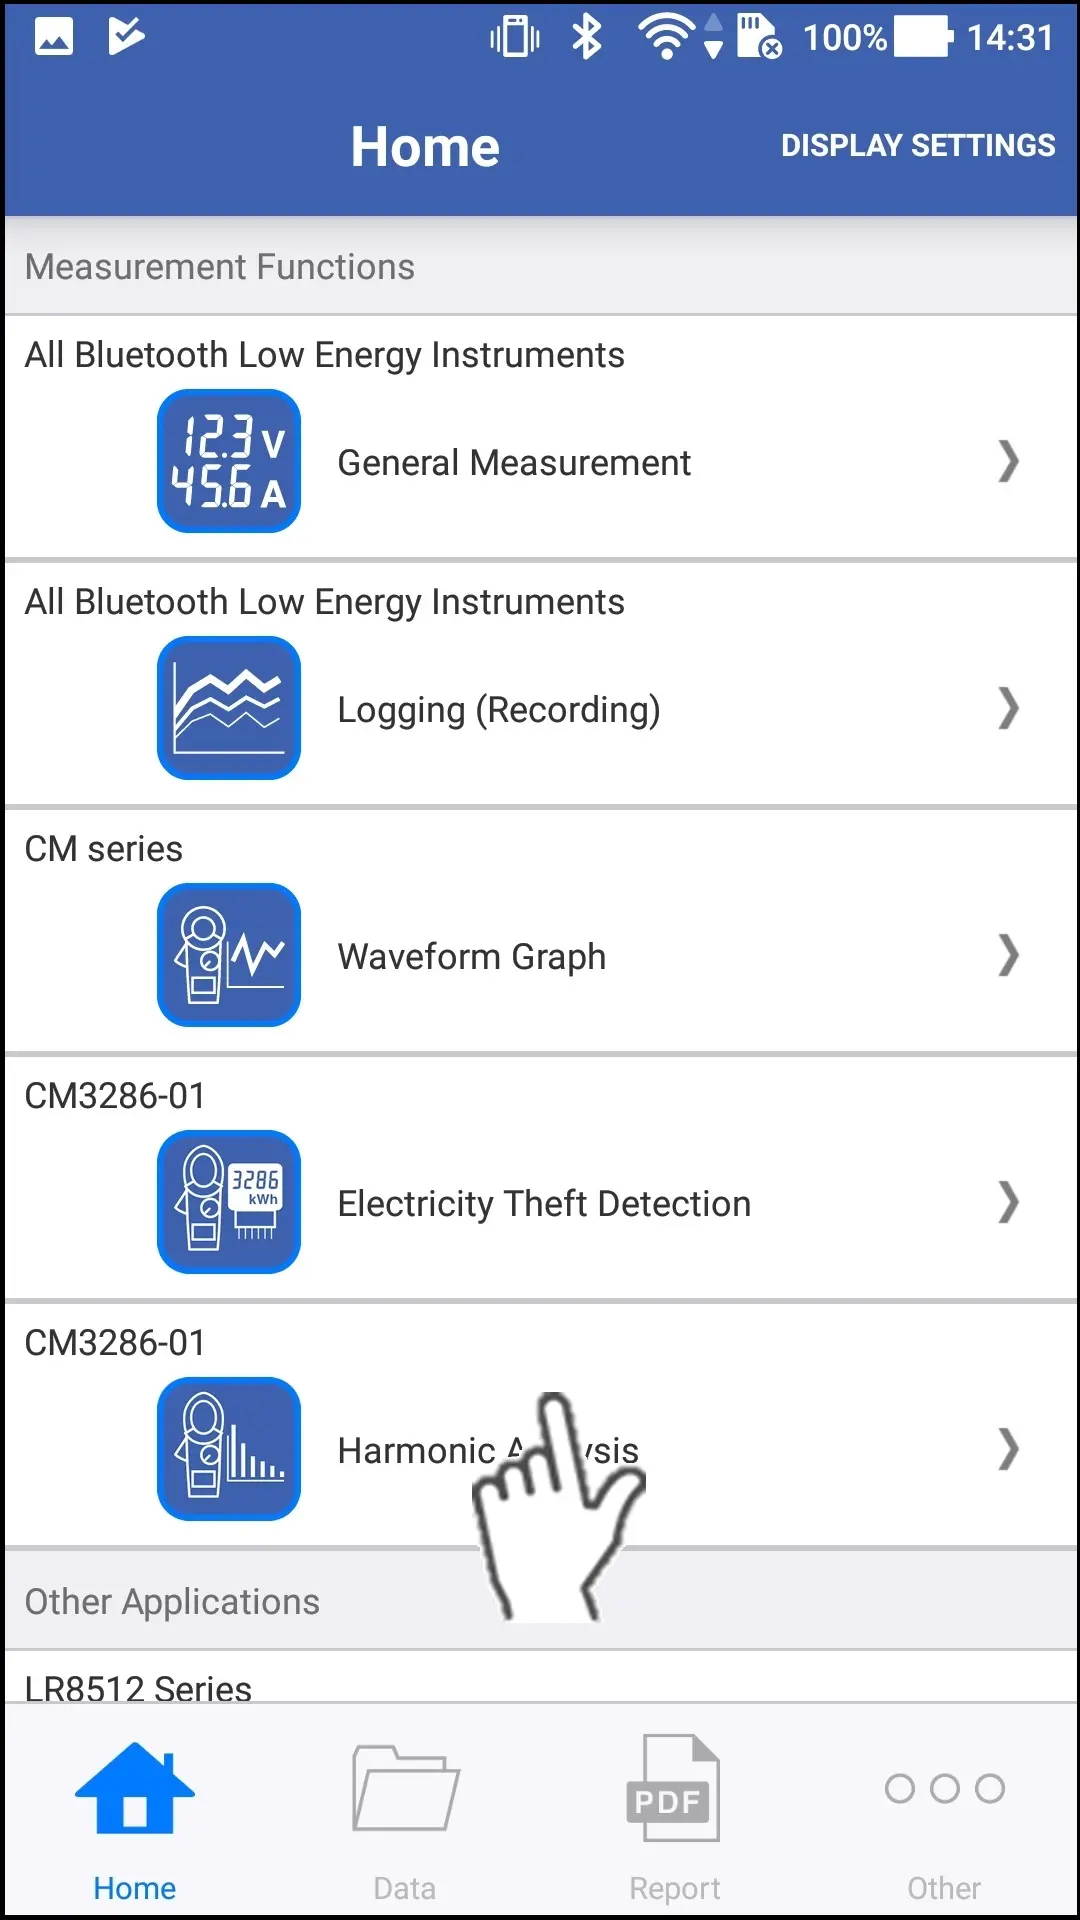
Tap the "Harmonic Analiysis" on the home screen.
If you cannot find an instruments which can utilize the "Harmonic Analiysis" function, please refer to Add other measurement instruments in advance.
2
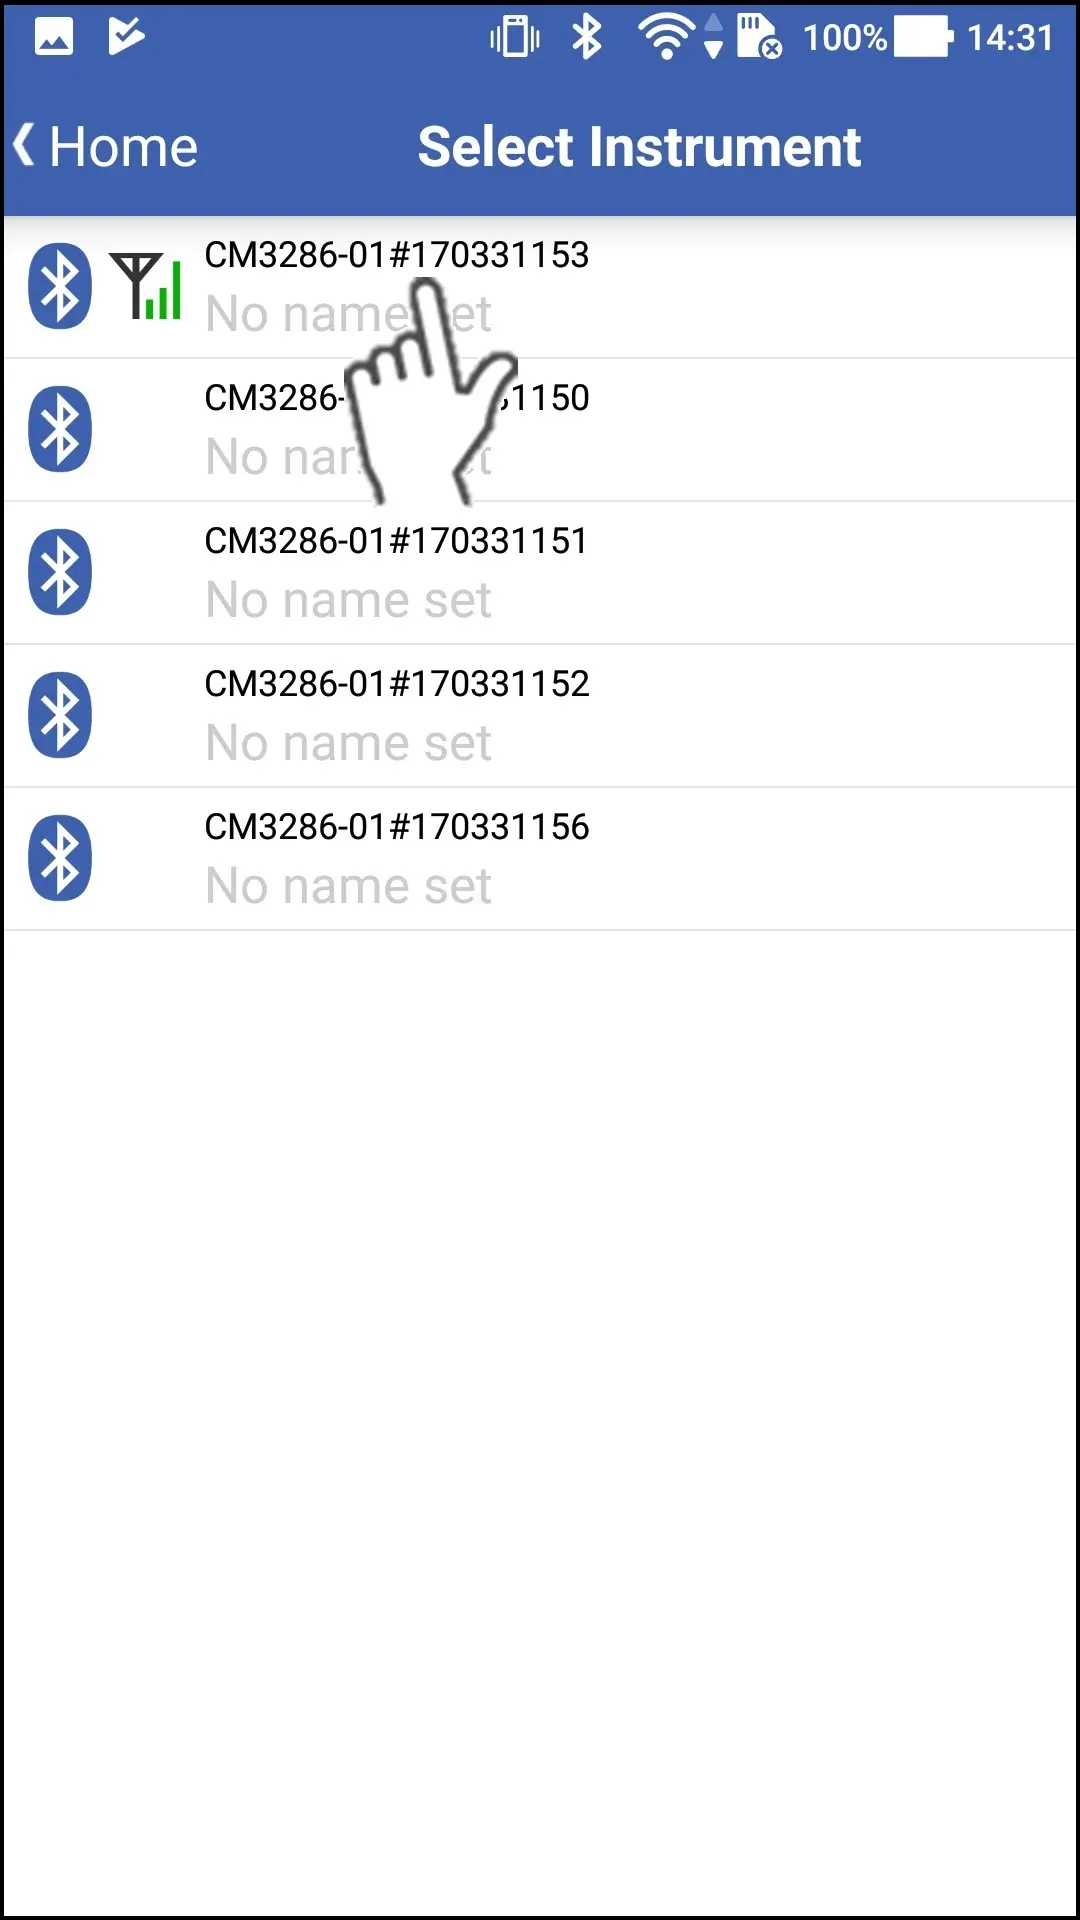
Wait up to 30 seconds until you find the instrument on the "Select Instrument" screen, then select the one which you would like to monitor waveforms with.
If the instrument hasn't connected after 1 minute, please refer to 「I can’t connect to GENNECT Cross」
3
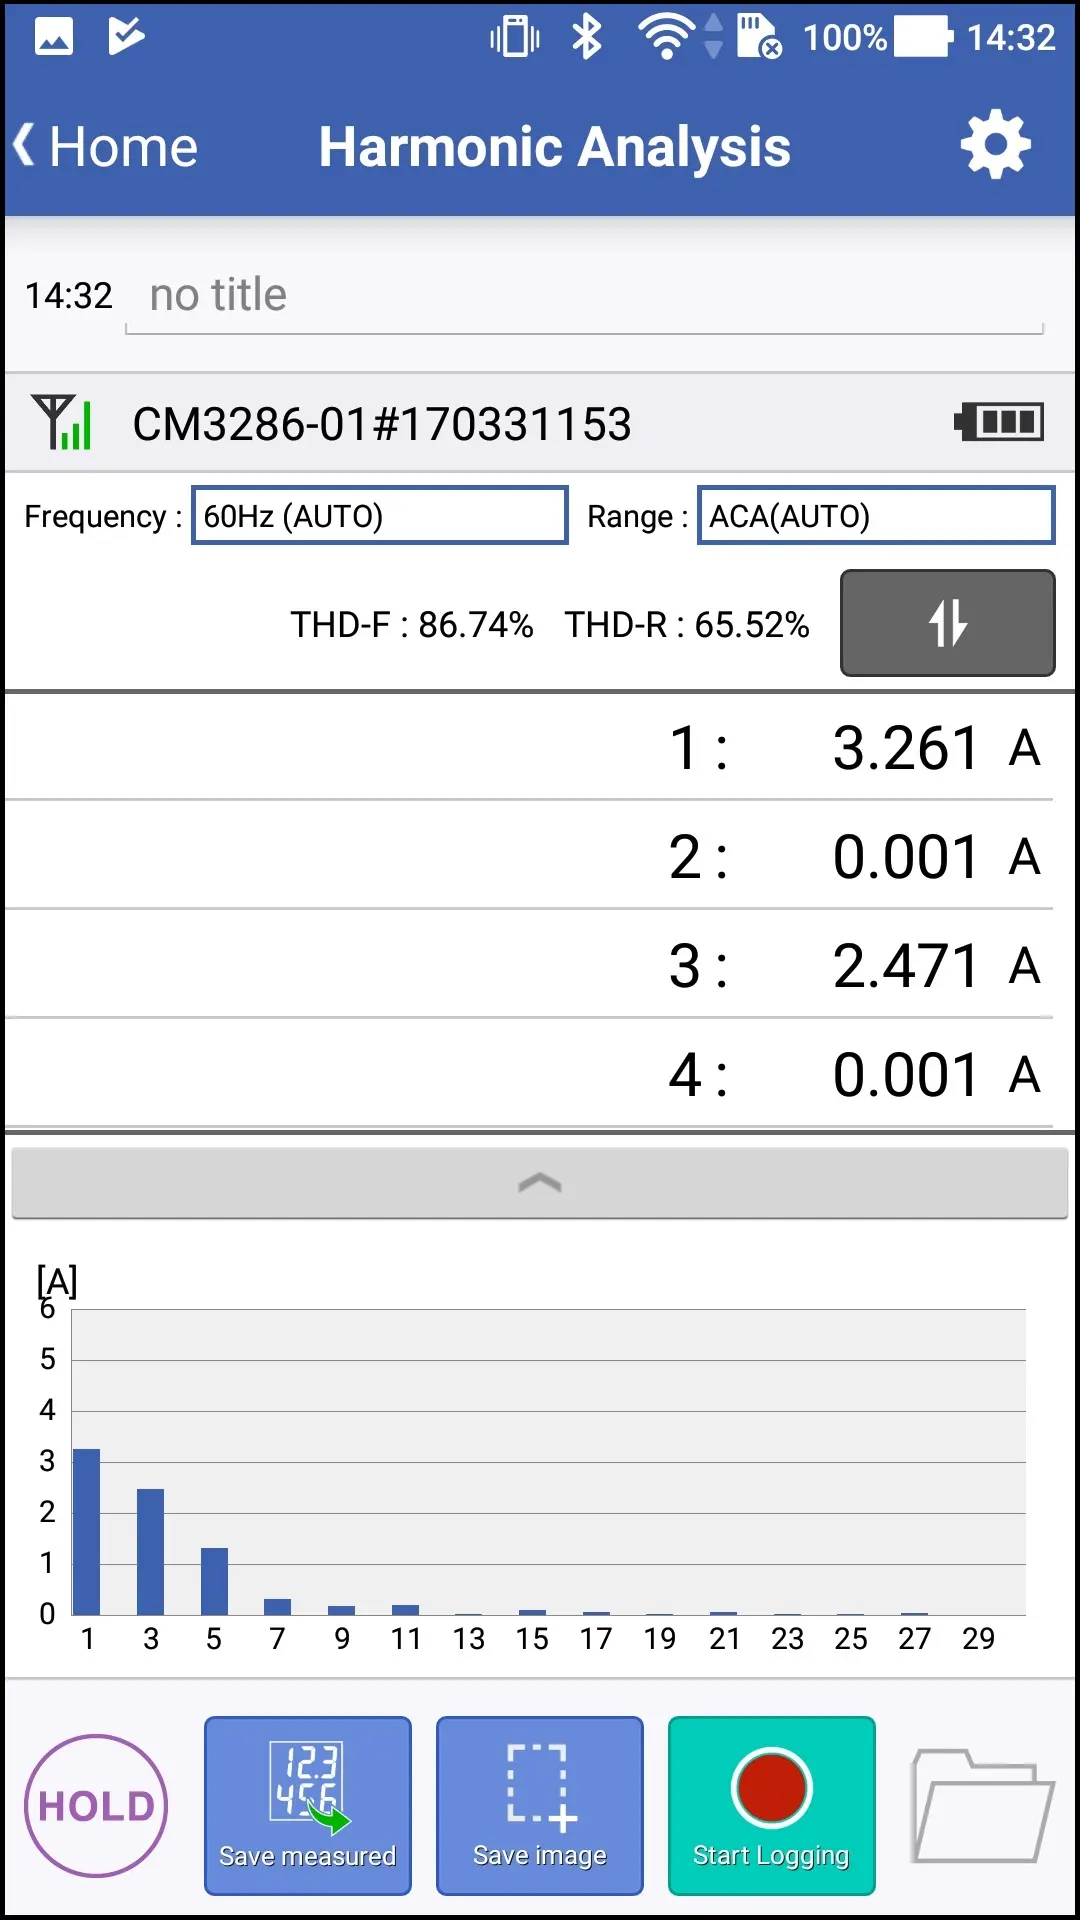
Measurement values and graph of harmonic analysis are displayed at regular time intervals (about 5 seconds).
Tapping the display area switching bar, then you can switch the screen as follwos: "Harmonic Graph" → "List" → "List and Harmonic Graph".
Tapping the list display order, then you can switch the list as follwos:"Descending order of values" → "Ascending order of Degree".
If you want to change the display content such as "I want to display only the odd number of list display", "I want to display the input waveform", then please refer to Configure the Show Setting.
Tapping the list display order, then you can switch the list as follwos:"Descending order of values" → "Ascending order of Degree".
If you want to change the display content such as "I want to display only the odd number of list display", "I want to display the input waveform", then please refer to Configure the Show Setting.
4
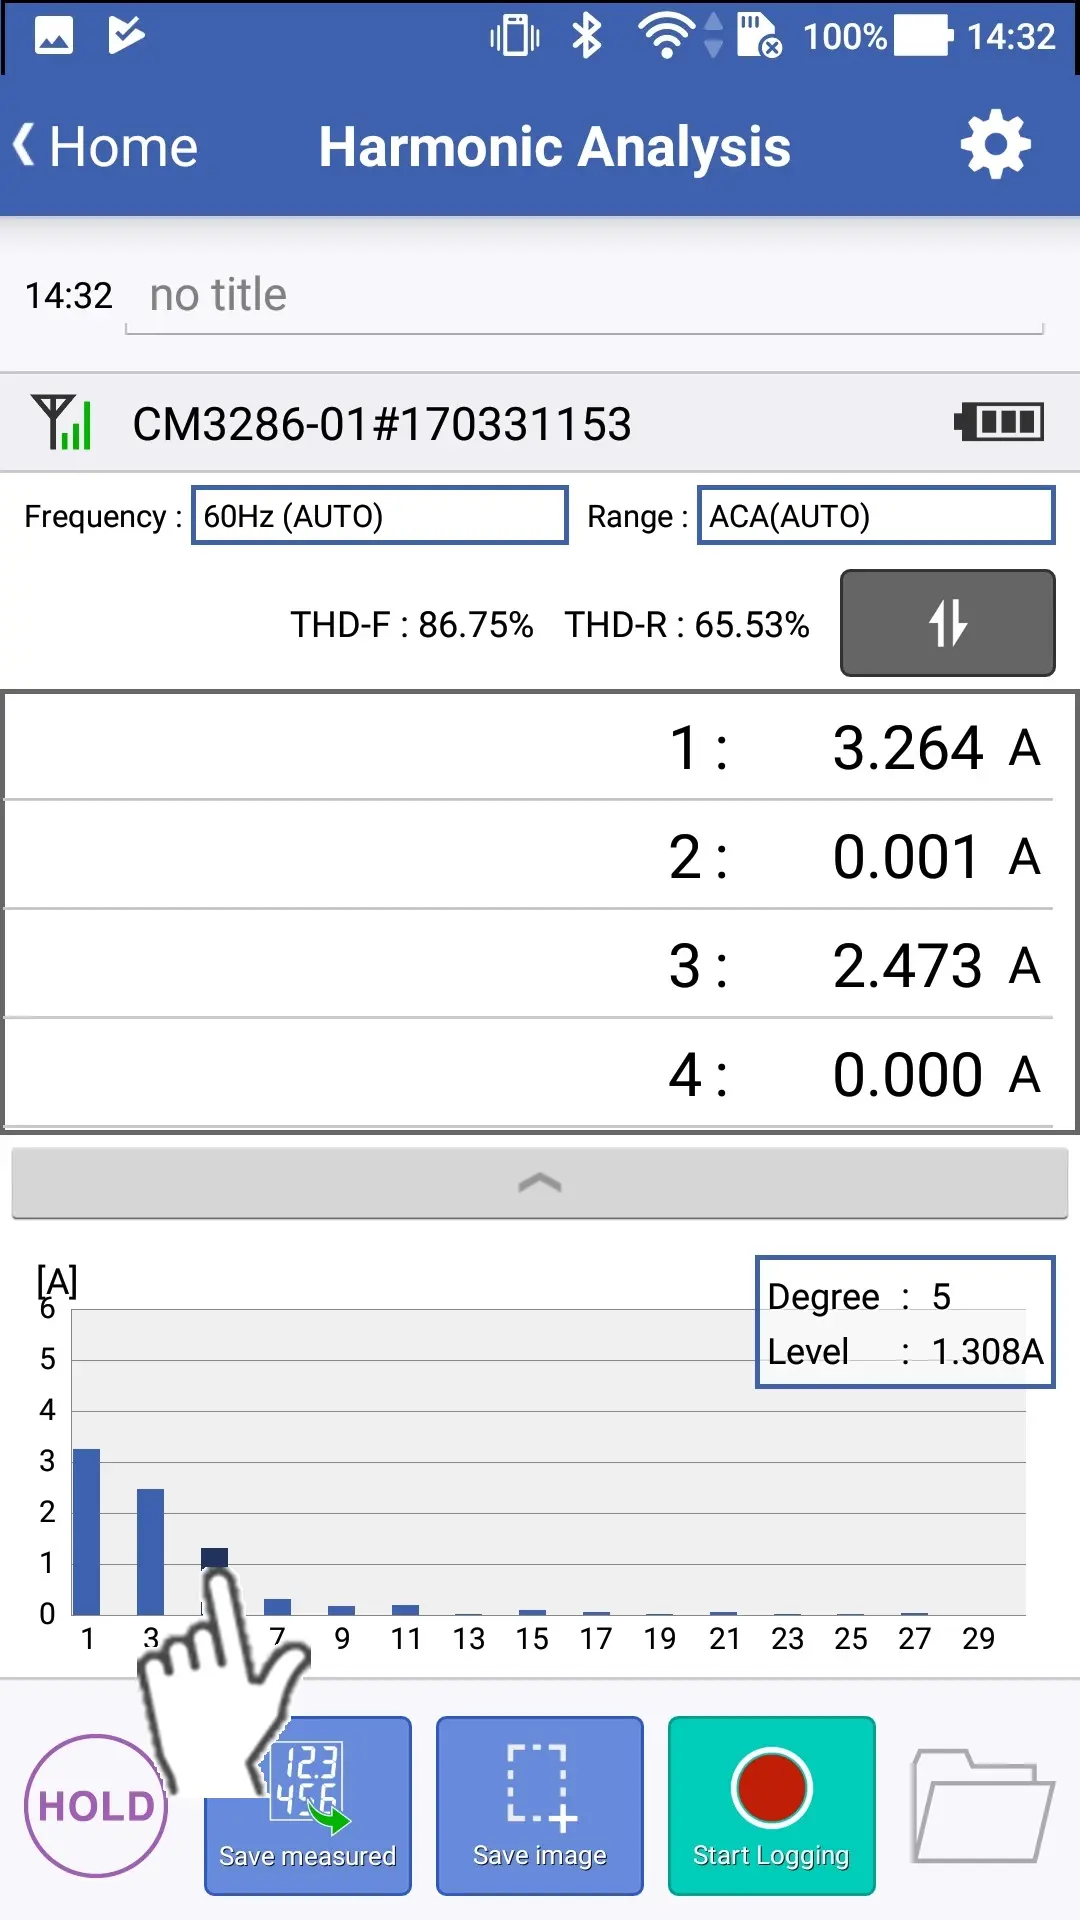
Tap the graph with your fingers and you can see the measured values of that degree.
5
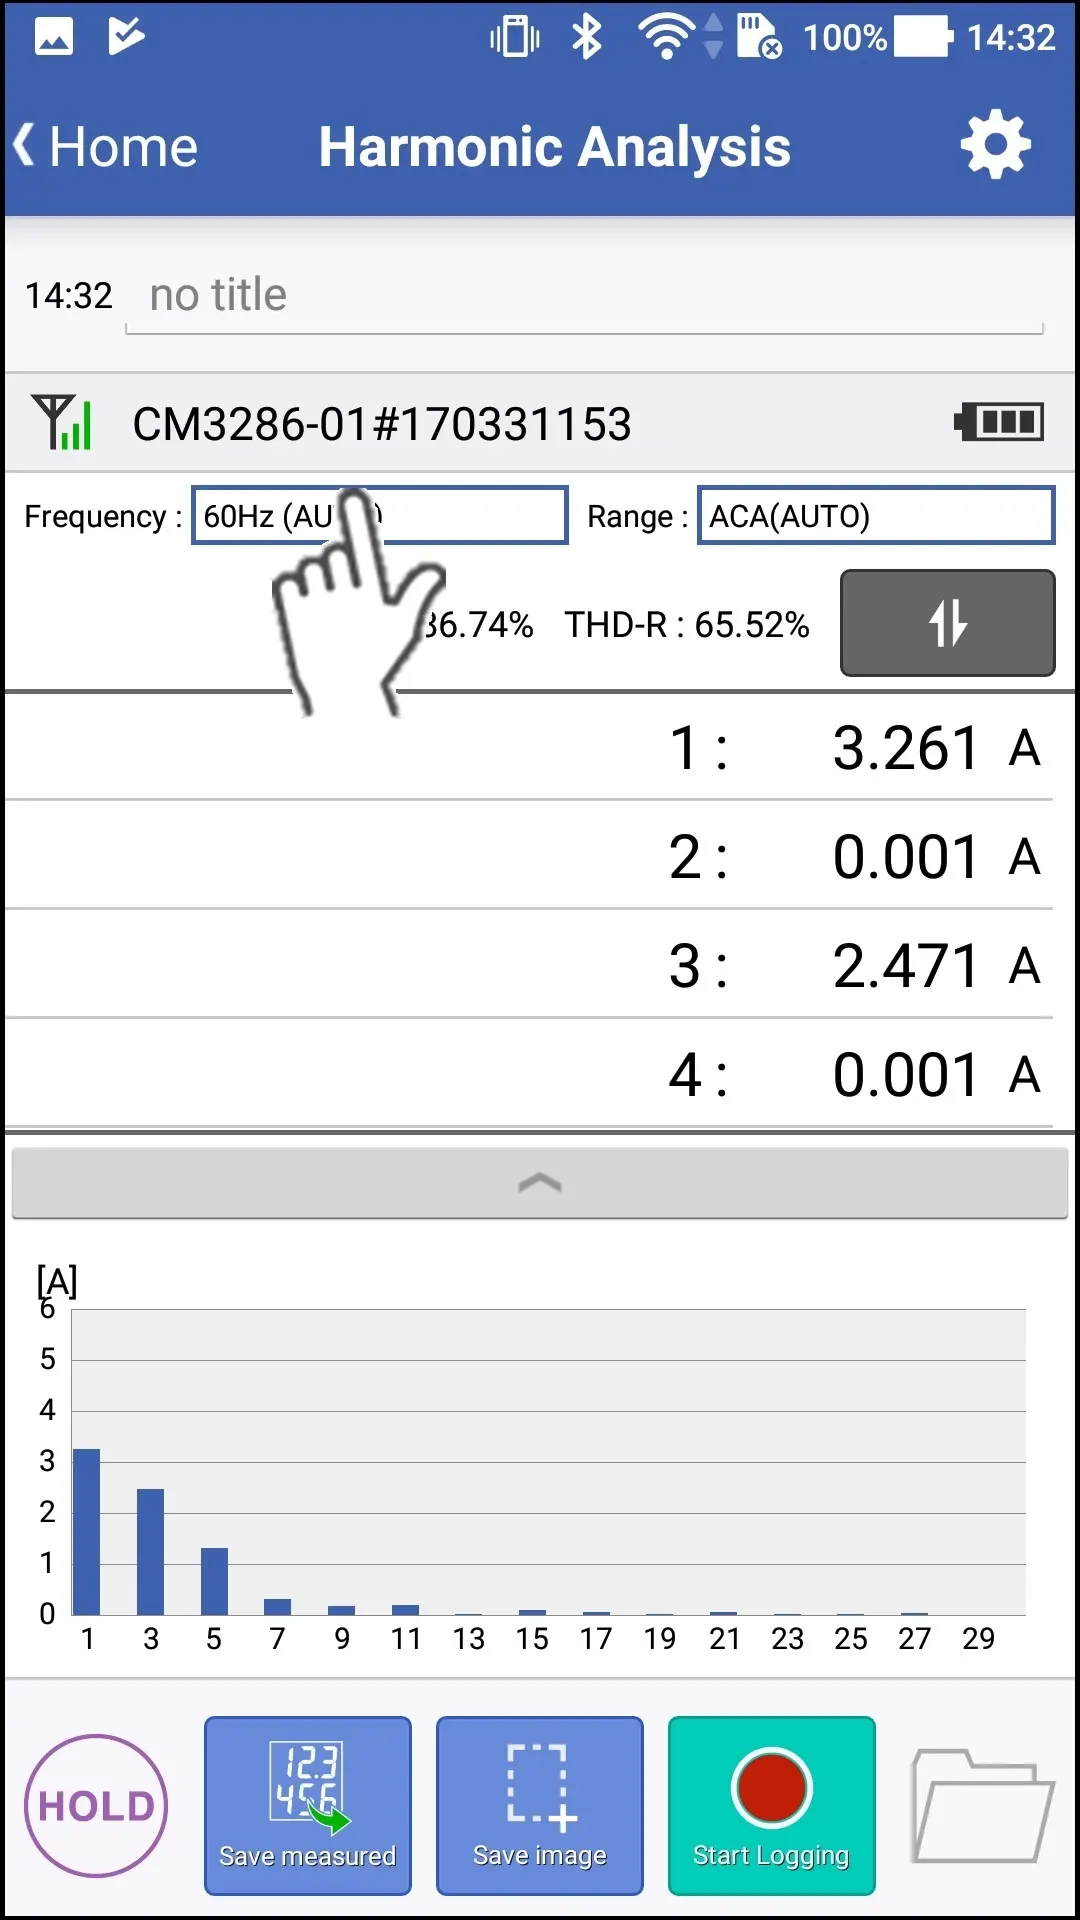
You can tap the blue frame to change the fundamental frequency.
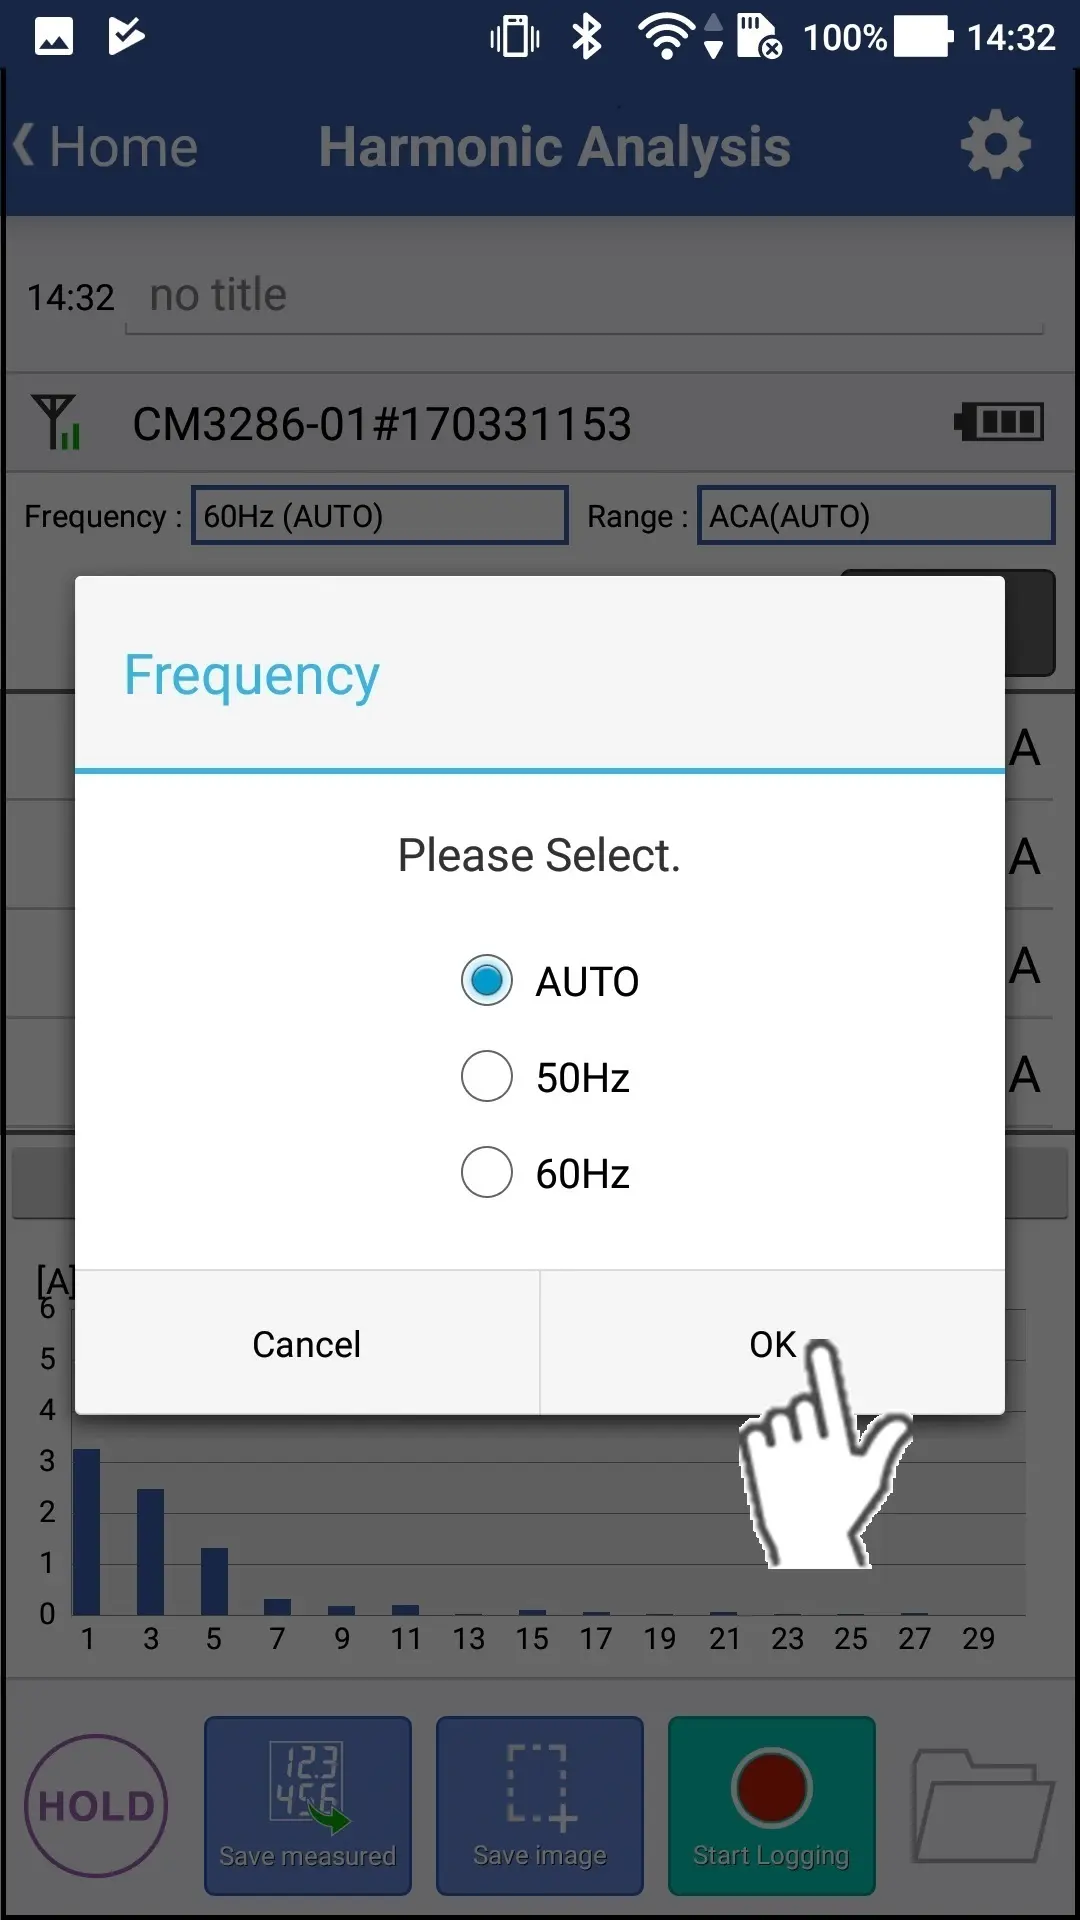
Automatic frequency detection (AUTO), 50 Hz fixed, or 60 Hz fixed can be selected.
The default setting is AUTO.
The default setting is AUTO.
6
dialog for setting the fundamental frequency is displayed, so select the frequency and tap "OK".
7
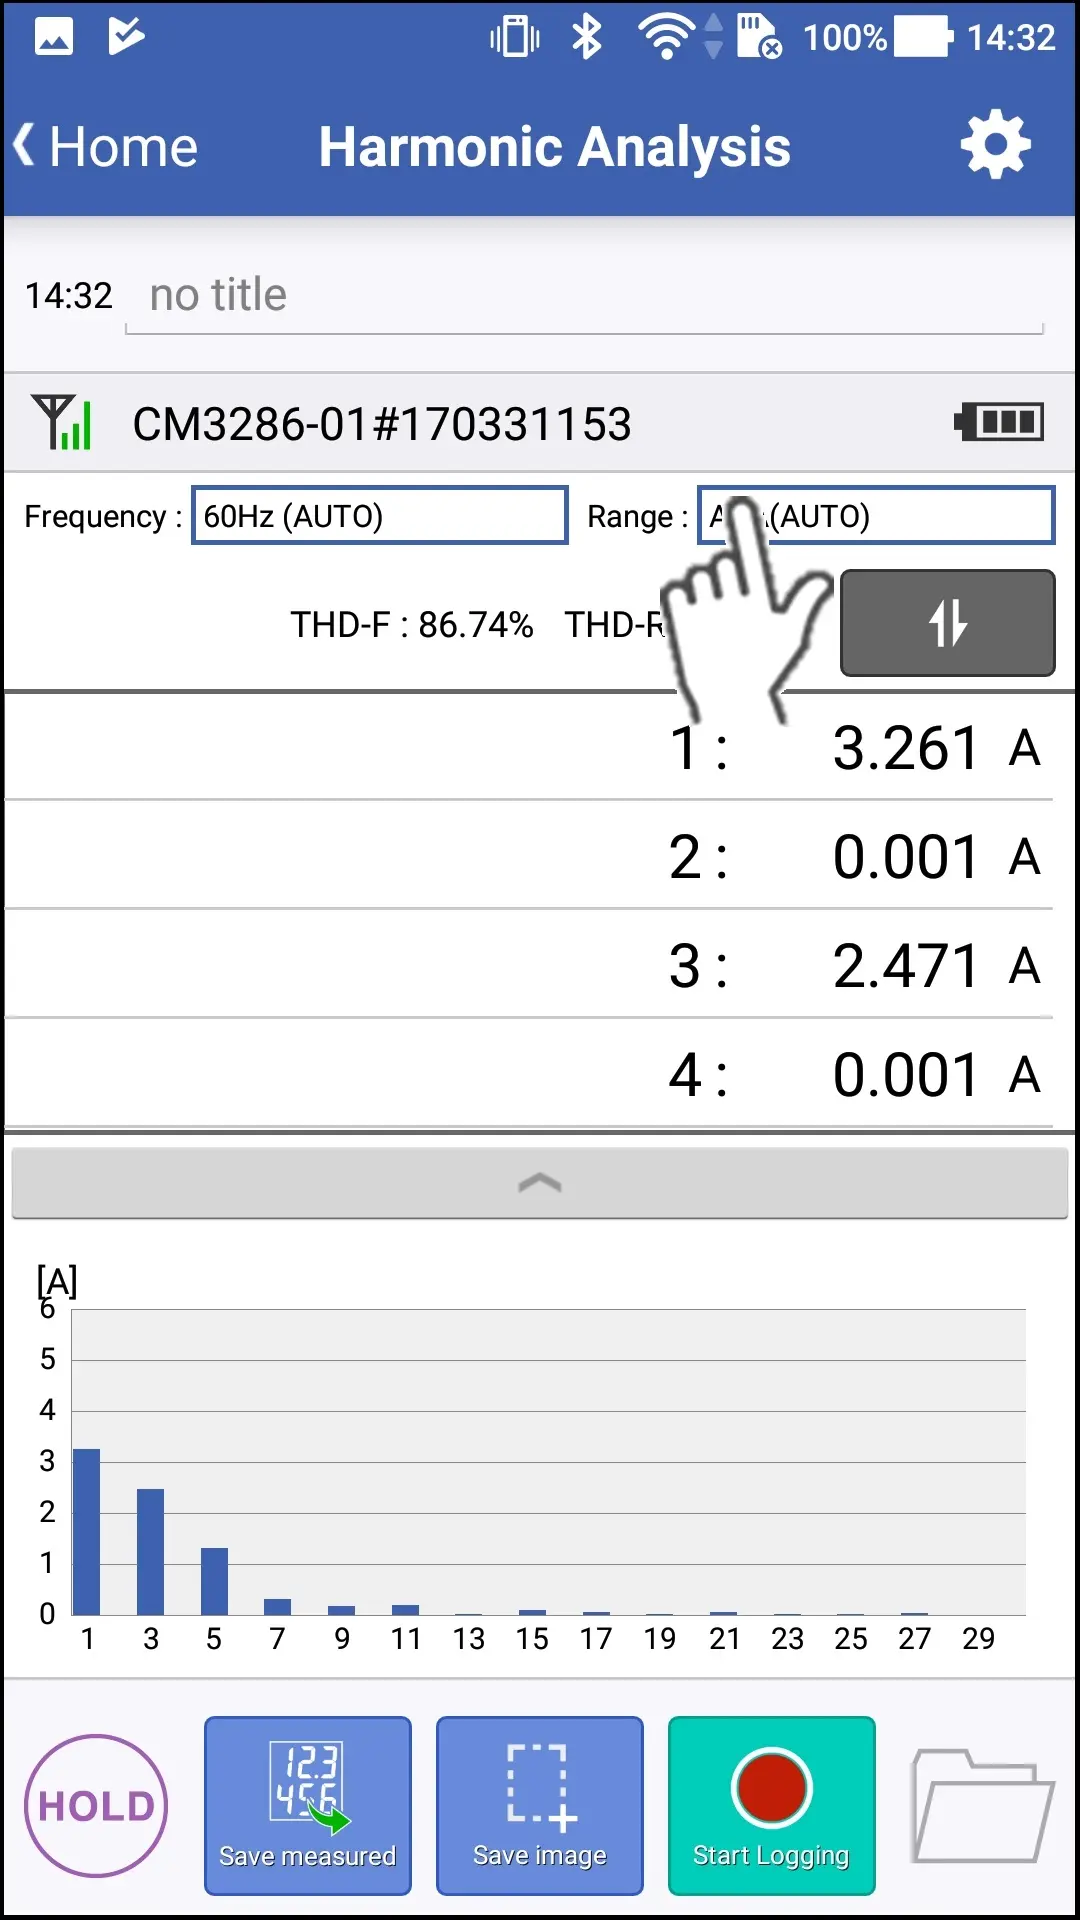
You can tap the blue frame to change the range.
The default setting is ACA (AUTO).
8
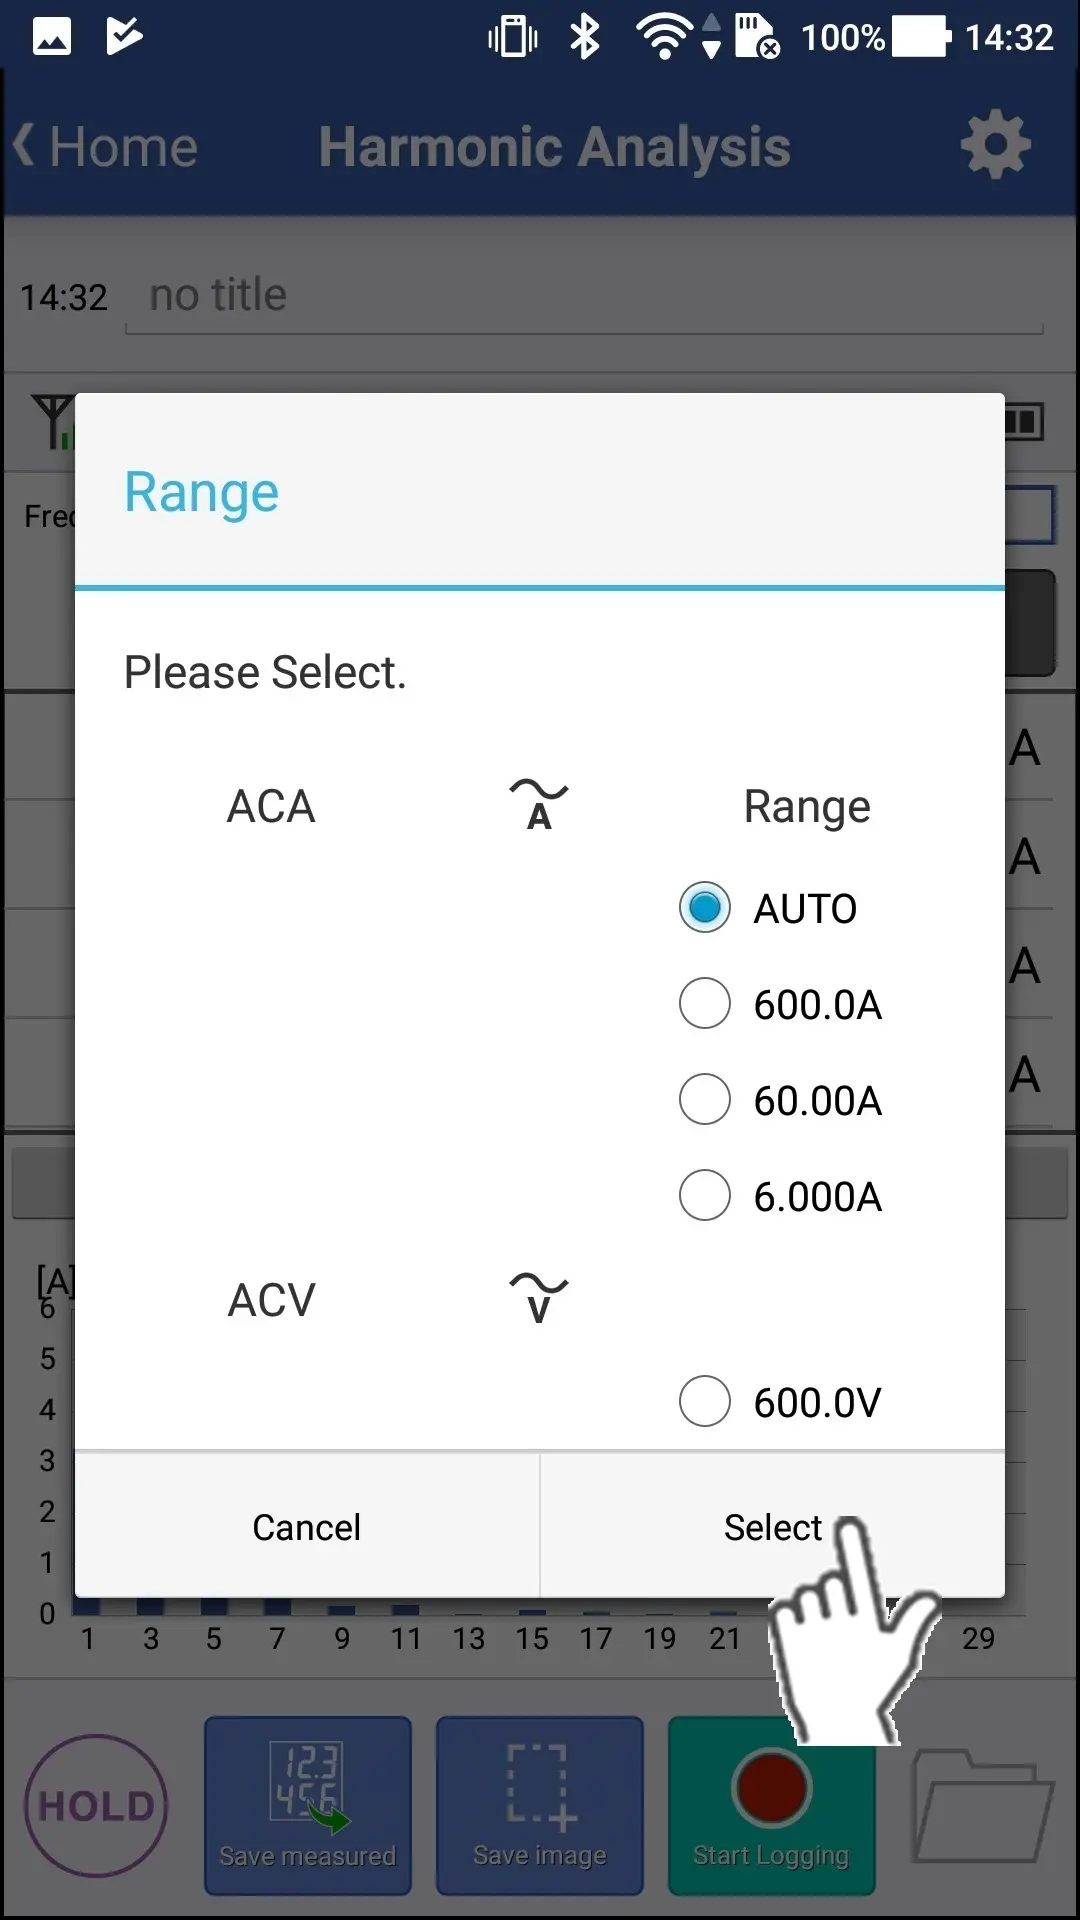
A dialog for setting the range is displayed, so select the range and tap "Select".
Want help or have questions?