

Registering a new dashboard panel
Select the channels you want to display on the dashboard from the monitor screen
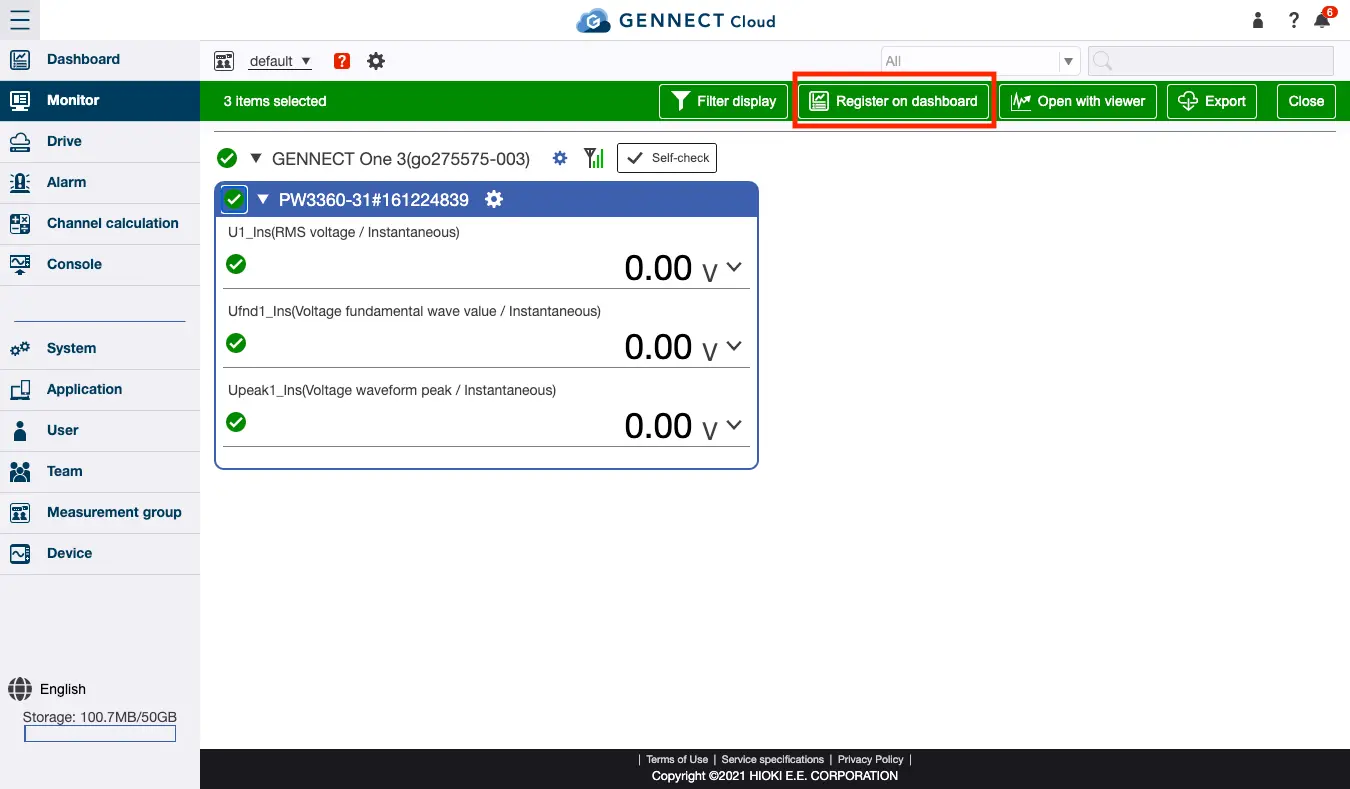
Click [Channel selection] and select the checkboxes for the channels you wish to register on the dashboard. Then click [Register on dashboard].
Select and set the panel type
- Panel Type
Select the panel type. Please refer to "What is a dashboard?" for the explanation of each panel type. - Aggregation Period
This can be selected only when the panel type is "Graph + Value" or "Graph Only". Select the period of data to be displayed as a graph.- Last 1 hour: Display update interval and data aggregation interval is every minute.
- Last 1 day: Display update interval and data aggregation interval are every minute.
- Last 1 week: Display update interval and data aggregation interval are every 5 minutes.
- Aggregation type
This can be selected only when the panel type is "Graph + Value" or "Graph Only". Select the aggregation method of data to be displayed as a graph. - Display Image
This can be selected only when the panel type is "Image + Value".
To use a camera image, check the checkbox for the camera you wish to use when selecting channels.
To use any still image, drag and drop or click in the area to select the image you want to use from your computer.
Click [Confirm] to register a new dashboard panel and go to the dashboard screen.
Select alarms to be displayed on the dashboard from the alarm screen
Alarms created in advance can be registered on the dashboard.
Please refer to "Setting alarm conditions for GENNECT polled data" for how to create alarms.
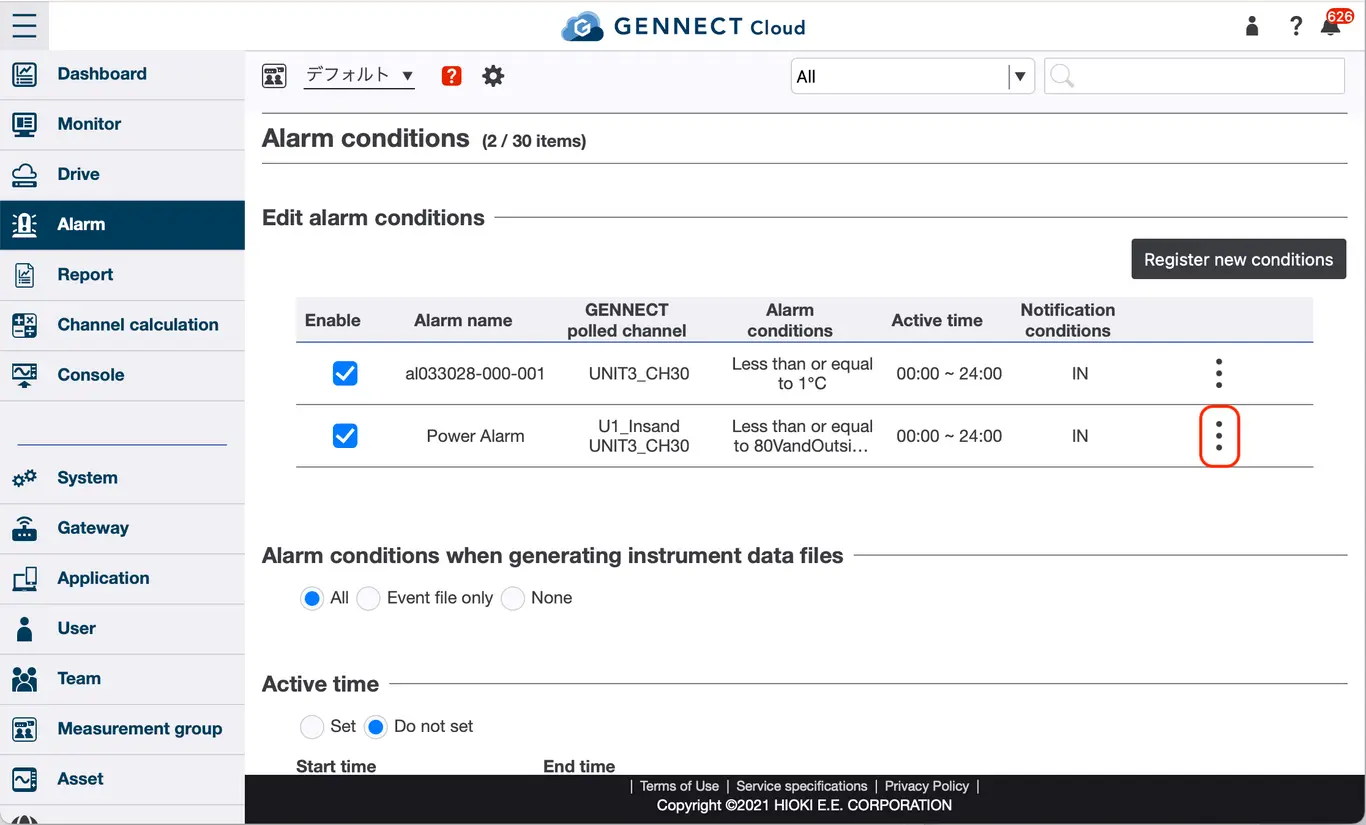
From the alarm screen, click the icon in the image, and then click [Dashboard].
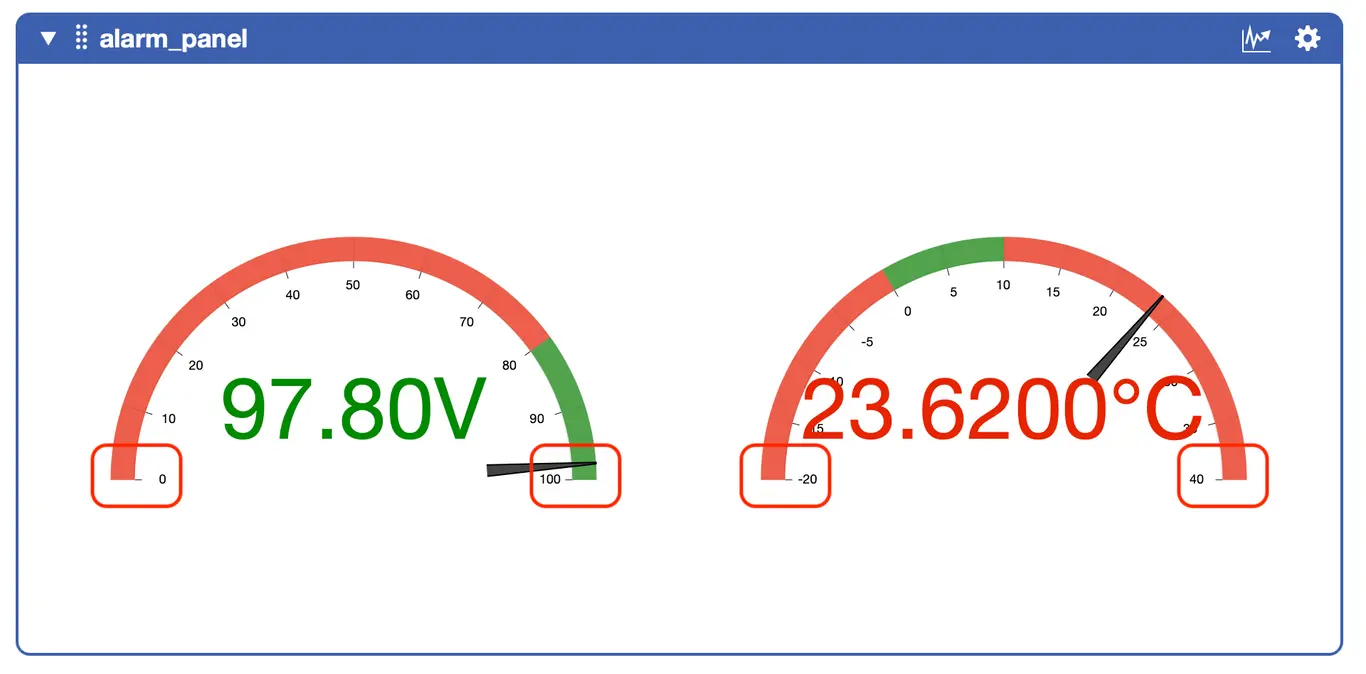
Enter the panel name and the display range of gauges for the alarm to be displayed and click [Confirm].
The upper and lower limits of the gauge are the values circled by the red lines in the image below.
Want help or have questions?